Supply Chain Analytics

What it is, why you need it, and best practices. This guide provides definitions and practical advice to help you understand the role of analytics in supply chain management and establish world class supply chain analytics.

Diagram showing how data from operational sources is processed using supply chain analytics to provide actionable insights and application events.

What Is Supply Chain Analytics?

Supply chain analytics refers to the tools and processes used to combine and analyze data from multiple systems to gain insights into the procurement, processing and distribution of goods. Bringing together data from your supply chain management (SCM) and enterprise resource planning (ERP) applications gives you a comprehensive view of your logistics network and broader insights which help you to predict and improve performance.

Supply Chain Analytics Benefits

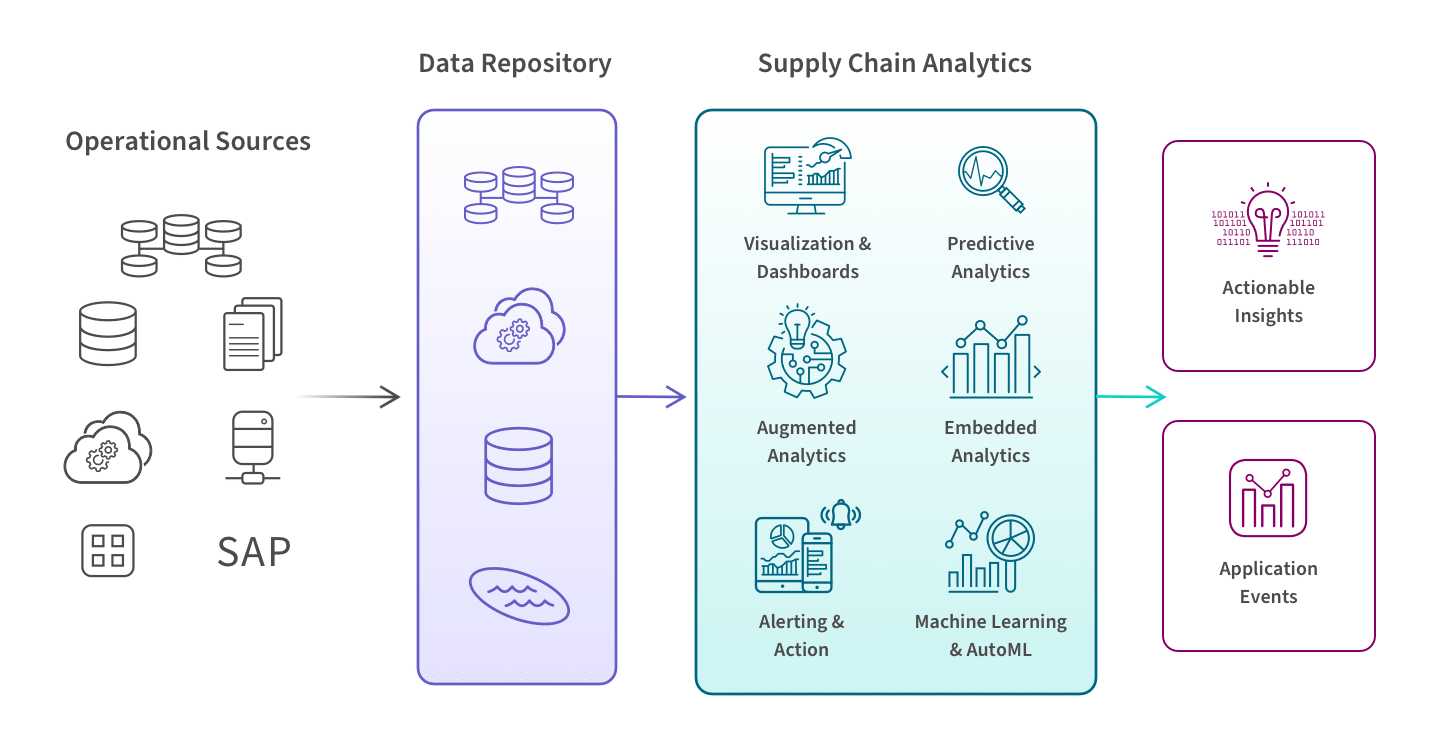
With today’s distributed global supply chains and the continual disruptions, all stakeholders need to be tightly coordinated to ensure flexibility, resiliency and rapid product or solution time-to-market. Modern supply chain data analytics brings you end-to-end visibility into every step of your logistics network and even supports real-time demand and supply shaping. Here are the specific benefits for your organization:

How Supply Chain Analytics Works

Modern supply chain analytics is powered by a cloud-based, end-to-end data integration and analytics platform. This platform helps you manage data across its lifecycle as well as perform the necessary types of analytics.

Diagram showing how data from operational sources is processed using supply chain analytics to provide actionable insights and application events.

Let’s walk through the diagram above.

  • Data is sourced from operational systems which manage steps in the supply chain such as procurement, inventory, orders, warehousing, fulfillment, and transportation. Data from third-parties such as suppliers, carriers, and merchants can also be included.

  • This data is extracted, transformed, and combined into a repository such as a data warehouse or data lake, typically in the cloud. This gives you a comprehensive view of your logistics network.

  • Your supply chain data analytics tool makes it easy for you to use this data to perform different types of analysis. For example, you could use supply chain predictive analytics to project returns so you can calculate outstanding inventory.

  • Your tool also allows you to create interactive visualizations and dashboards which help you identify patterns and develop insights into KPIs such as fulfillment performance, current vs ideal inventory distribution, and transit times.

  • Top tools go further and enable you to leverage augmented analytics capabilities such as automated machine learning (AutoML), predictive analytics, and prescriptive analytics and to embed your analytics into other applications.

  • This results in insights which you can action on and/or trigger alerts and actions in other systems.

Anticipate and Respond to Disruption

Learn how you can take informed action ‘in the moment’.

Supply Chain Analytics Types

Here are the four types of supply chain data analytics and the questions answered by each:

Descriptive analytics summarizes historical trends in dashboards, visualizations, or reports.

  • It answers the question, What happened? or What is happening? For example, “What is our days on hand inventory for each SKU?”

Diagnostic analytics requires your intuition to develop hypotheses on what might be causing an issue. Then it makes it easier for you to explore and analyze the data to find patterns.

  • Answers, Why did something happen? For example, “What is causing our shipment delays?”

Predictive analytics uses statistical models to identify patterns in your data to project the probability of outcomes or forecast trends based on current and/or historical data.

  • Answers, What will happen? For example, “What will consumer demand be next month?”

Prescriptive analytics uses advanced machine learning to analyze data and recommend the optimal course of action or strategy moving forward.

  • Answers, What should we do? For example, “What’s the optimal inventory level for each product for each warehouse?”

Types of Analysis
Supply chain analysis refers to specific investigative actions to better understand your company’s past, present, or future performance. This analysis uses one of the types of analytics described above. For example, you would conduct a predictive inventory analysis by using a supply chain predictive analytics correlation model. There are many types of supply chain analysis you can perform such as order accuracy, on-time shipment, average fulfillment cost, and warehouse receiving turnaround time.

Here’s an example of an interactive supply chain dashboard measuring items over and short by location:

Screenshot of an interactive supply chain dashboard.

Real-Time Supply Chain Analytics

Legacy SCM and ERP solutions were never intended for real-time decision-making; they primarily answer known questions using historical data. And that won’t give you the visibility or the agility you need to manage complex and ever-changing operations.

It’s now possible to establish in-the-moment awareness of your supply chain through real-time information. The best supply chain analytics tools can continuously funnel real-time information such as inventory flow or shipping performance from suppliers, partners, warehouses, and stores to analytics for instant insights that enable immediate, informed action.

The concept, sometimes called “active intelligence”, begins with data integration to bring all your disparate sources together. The raw data is then transformed as it moves through the pipeline to deliver up-to-date information. Real-time alerting then brings actionable insights or triggers automatic, immediate actions in other applications.

Automation, artificial intelligence and machine learning eliminate painstaking human analysis, provide the ability to highlight potential issues before they happen, and raise pertinent questions (and answers) that haven’t yet been considered. The data is executed moment to moment and embedded directly into supply chain and machine-driven processes. Not only do your teams know what is happening right now, they can understand what is likely to happen and they are alerted to take action when specific conditions are met.

Use Case Example: Supply Chain Disruptions
Here’s an example of how you would use real-time supply chain analytics to anticipate and solve for a lack of raw materials due to supply chain disruptions:

  1. Bring together data from SAP (sales orders), CRM (customer data), and Oracle WMS (inventory) and land it into Azure.

  2. Explore data profiles and lineage to help reconcile customer data between SAP and CRM, establishing trust in the CRM data.

  3. Develop a machine-learning model to forecast the order fulfillment rate using demand data from CRM and supply data from SAP and WMS.

  4. Query the data with natural language questions, such as: “Sales orders by month” and “Sales orders by top 10 customers.”

  5. Monitor charts in the hub in real time and set up alerts for the largest orders and top customers.

  6. Alert the Customer Service and Customer Accounts teams on Microsoft Teams so they can take proactive steps with customers.

Modern Analytics Demo Video

Modern Analytics Demo Videos

See how to explore information and quickly gain insights.

  • Combine data from all your sources

  • Dig into KPI visualizations and dashboards

  • Get AI-generated insights

Challenges

Here are two key challenges to be aware of as you implement modern supply chain analytics in your organization.

1. Data in different formats and silos. Supply chain data takes many forms and is in many different formats:

  • Master data to enable business processes such as material and product specs

  • Transactional data including purchasing inventory records and sales figures

  • Unstructured data from IoT sensors and more

There’s a lot of data, and it’s rarely in one place. Data sits in a variety of enterprise resource planning (ERP) and customer relationship management (CRM) applications, in warehouse management systems (WMS) and a variety of other back office and factory floor repositories. Typically, these systems are siloed. They don’t talk to one another. Which means bringing everything together to operationalize it and achieve end-to-end visibility is challenging. And that’s before you begin your analysis. The bigger the organization, the bigger the challenge. So when it comes to getting insights, your teams are often looking for a needle in a haystack.

2. Passive data. Traditional data and analytics processes don’t provide real-time information about your suppliers, operations, and sales. With the speed of business today, you need to take immediate action and you need to predict future outcomes that compel timely action today. So you need visibility into what’s happening right now. As stated above, real-time data and analytics pipelines can now deliver data to trigger immediate action.

See Modern Analytics in Action