Financial Analytics

What it is, why you need it, and best practices. This guide provides definitions and practical advice to help you understand financial analytics.

What Is Financial Analytics?

Financial analytics is the use of tools and processes to combine and analyze datasets to gain insights into the financial performance of your organization. Bringing together data from all your systems gives you a holistic view of your business and broader insights which help you to predict and improve performance.

Why is it Important?

Modern financial analytics can be truly transformational–at both the departmental and organizational level. Your finance team will have more time to focus on deeper discovery and analysis. And new tools and techniques allow you to gain accurate and actionable insights that reduce costs and manage risks, improve profitability, and predict and plan for the future.

This helps transition the role of CFO from scorekeeper to being a key catalyst in wider business performance. Because ultimately, it helps you identify and assess your organization’s value drivers–the factors that increase the worth of your business.
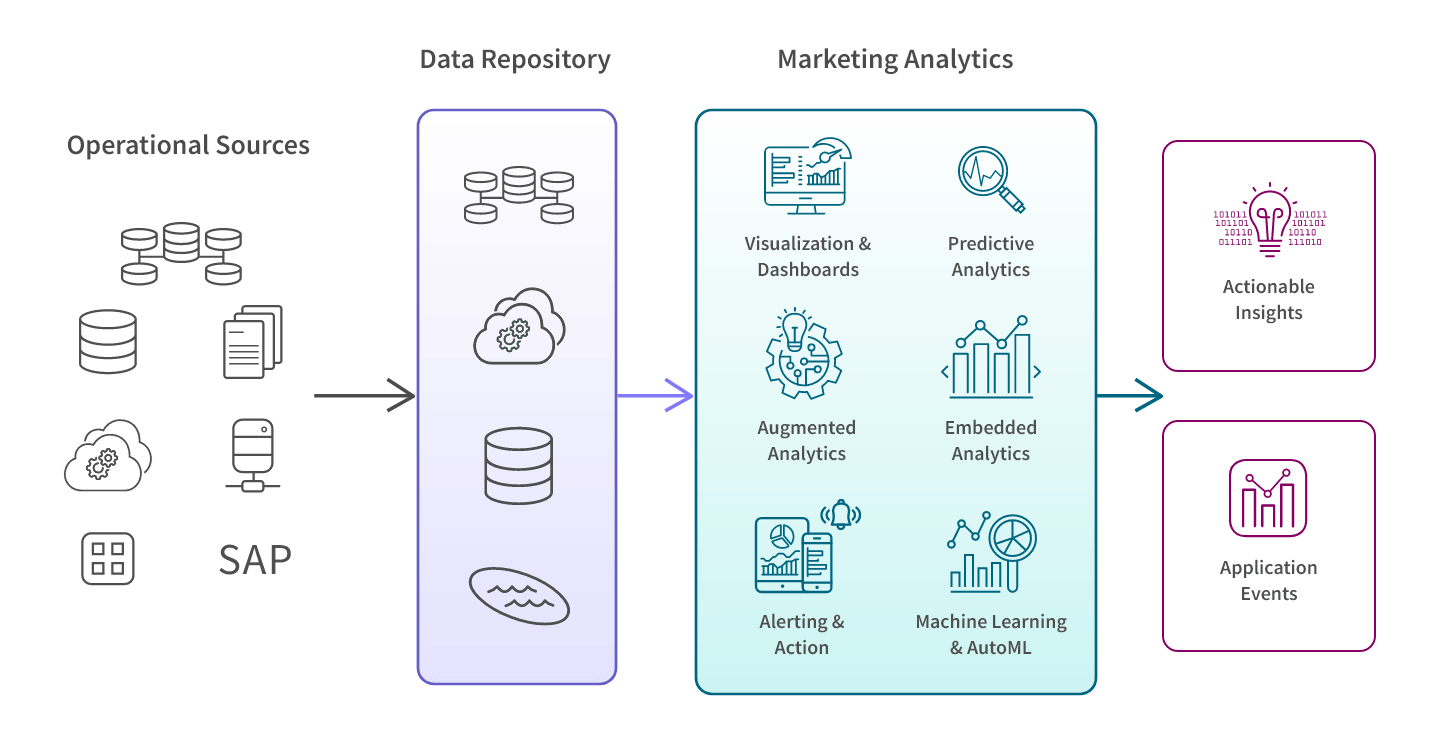
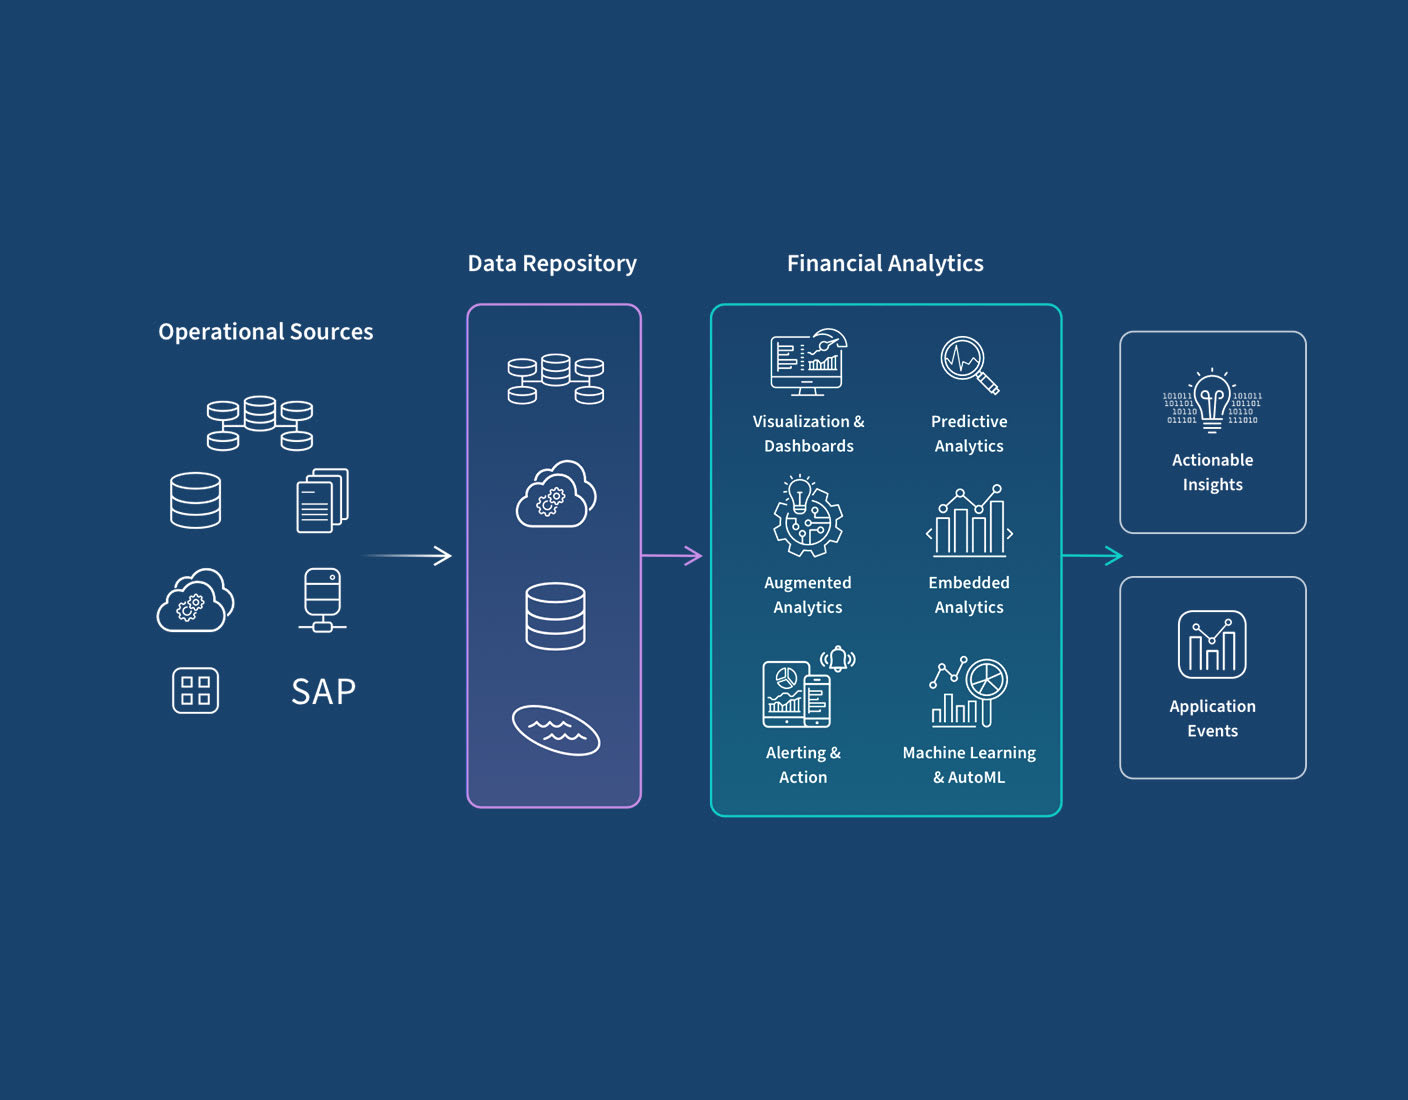
Let’s dig deeper on how your finance operations become simpler, faster, and more informed:

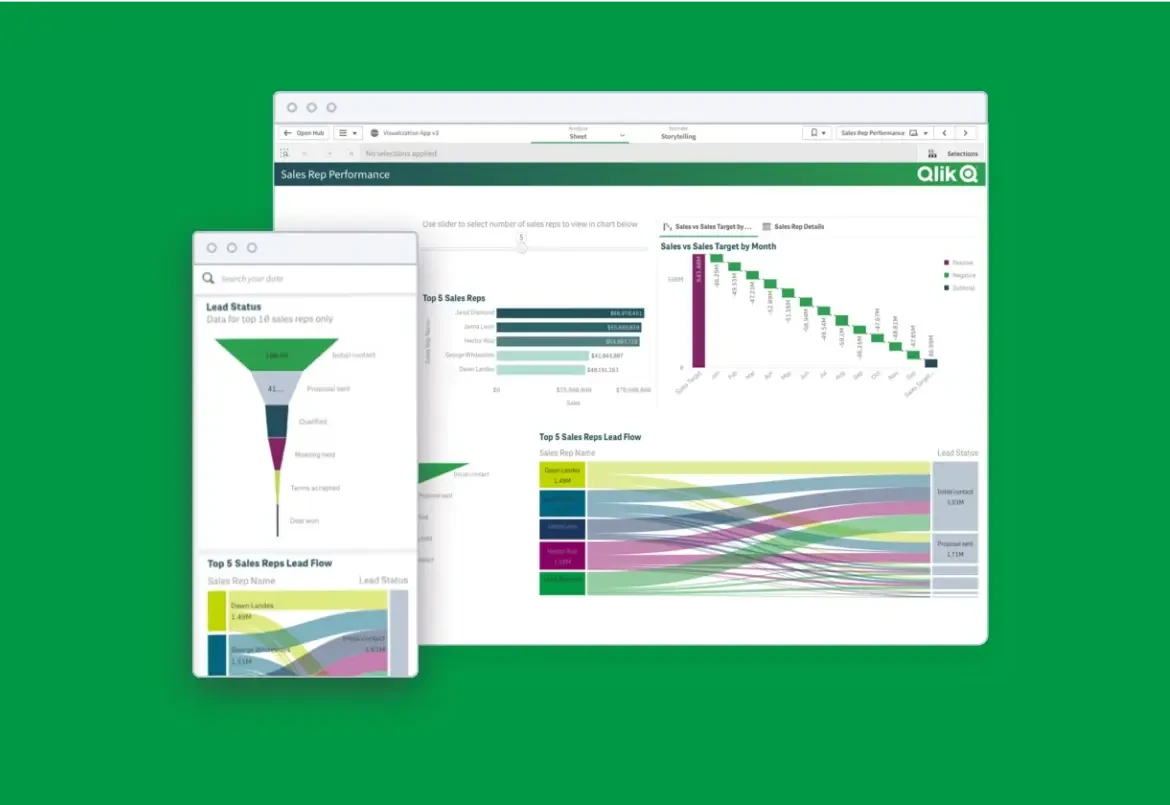
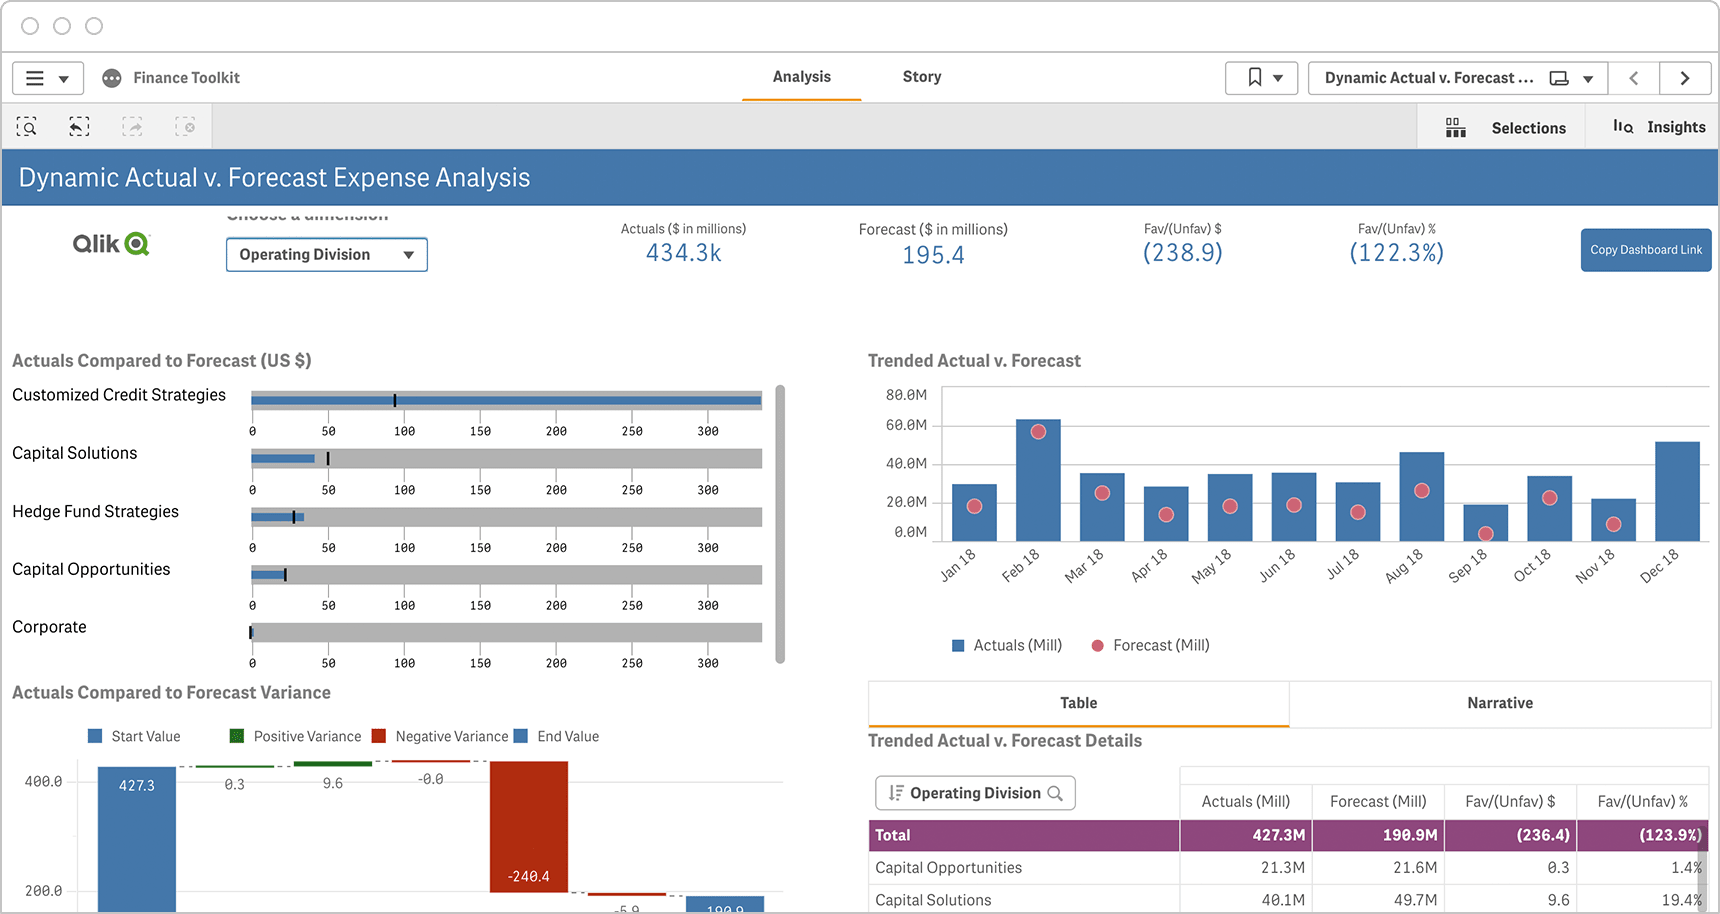
  • Your teams have complete and near real-time visibility of actuals vs budgeted performance.

  • Slow, static, and often inaccurate reporting is transformed into a slick, automated process.

  • Expenses and overspend becomes easy to manage. Concerns over duplicated vendor payments are eliminated as the data’s doing the work for you.

  • You don’t need to find the data you need across multiple silos because it’s already at your fingertips.

  • And you don’t need to pour over it to see what actions are required because you’re being alerted in real time when something needs to happen.

  • And the insights delivered by modern analytics can be extended to everyone – eliminating repetitive manual tasks.

How Financial Analytics Works

Financial data analytics is an aspect of business intelligence (BI) and enterprise performance management (EPM) systems, and key to strategic financial planning & analysis. Ideally, your financial analytics tool is an end-to-end data integration and analytics cloud platform which can help you manage data across its lifecycle.


Let’s walk through the diagram above.

  • Data is sourced from operational systems such as transactional, supply chain, and CRM applications

  • This data is extracted, transformed, and combined into a repository such as a data warehouse or data lake. Bringing together data from all your systems gives you a holistic view of your business.

  • Your financial analytics tool uses this data to allow you to perform a variety of financial analysis such as predictive sales analysis, cash flow valuation, or actual vs forecast analysis.

  • Your tool also makes it easier for you to identify patterns and develop insights by creating interactive visualizations and financial dashboards.

  • The best tools go further by enabling you to perform augmented analytics and predictive analytics, automated machine learning, embed your analytics into other applications, and trigger alerts and actions in other systems.

Modern Analytics Demo Video

Modern Analytics Demo Videos

See how to explore information and quickly gain insights.

  • Combine data from all your sources

  • Dig into KPI visualizations and dashboards

  • Get AI-generated insights

Key Types of Financial Analytics & Analysis

Here we distinguish the terms “Analytics” vs “Analysis” and describe the main types of each as applied to finance.

“Analytics”
Financial analytics is the use of processes and technology to combine datasets, perform analysis, and gain insights. Sometimes it can also trigger automated events. Here are the four main types:

  • Descriptive analytics answers, “What happened?” or “What is happening?” It requires human intuition and effort to analyze and summarize historical trends in KPI dashboards, data visualizations, or reports.

  • Diagnostic analytics answers, “Why did something happen?” It uses human intuition to develop hypotheses on what might be causing an issue and to explore and analyze the data to find patterns.

  • Predictive analytics answers the question, “What will happen?” It uses statistical models to identify patterns in your data to project the probability of outcomes or forecast trends based on current and/or historical data.

  • Prescriptive analytics answers the question, “What should we do?” It uses advanced machine learning to analyze data and recommend the optimal course of action or strategy moving forward.

“Analysis”
Financial analysis refers to specific investigative actions to better understand your company’s past, present, or future performance. This analysis uses one of the types of analytics described above. For example, you would conduct a predictive sales analysis by using a predictive analytics correlation model. (Think of financial analysis as a subset of financial analytics.) There are many types of financial analysis you can perform but here are two illustrative examples:

Cash Flow Valuation Analysis
This dashboard visualizes cash flow-related KPIs such as internal rate of return by region against a target IRR, the number of investments by type and a detailed cash flow table. Other real-time indicators you could include are cash conversion cycle and working capital ratio. And, to help with cash flow management, you could use regression analysis to add a cash flow prediction.

Actual v. Forecast Expense Analysis
This example shows how actual expenses compare to forecasts for a given time period and how they trend over time for each expense type. A modern, integrated financial dashboard makes it easy for you to drill into this data and gain actionable insights.

Diagram showing an Actual v. Forecast Expense dashboard

Other examples of financial analysis include:

  • Measuring the profitability of specific products or clients

  • Identifying and assessing your organization’s value drivers

  • Predicting future sales

  • Measuring shareholder value

  • Financial ratios such as the current, quick, liquidity, debt, and return on equity ratios

Learn More About Financial Analysis

How to Design Best-in-Class Dashboards - Image

It’s a new era for finance. And for data.

Download the ebook with 6 use cases of an active approach to financial analytics.

Challenges

Here are two key challenges to be aware of as you implement modern data financial analytics in your organization.

Passive data. The pace of business is faster than ever. But traditional data and analytics approaches are too passive to provide real-time information about your market, customers, and operations. You need to understand what’s happening right now so you can take immediate action. You also need to accurately predict future outcomes that compel timely action today.

Complex models & big investment. Historically, leveraging predictive and prescriptive analytics required you to find and hire data scientists to develop custom machine learning algorithms. Plus, you had to make significant investments in hardware and data engineers to integrate, store and manage your data.

  • The good news is that modern AutoML (automated machine learning) now makes it easier for you to build, train, and deploy custom ML models yourself. And you can secure the data storage and system power and speed you need with a cloud data warehouse.

See Modern Analytics in Action